
What is the price pullback indicator, and how does it help identify market corrections?
In financial markets, the Pullback Indicator is a technical analysis tool that helps traders identify temporary price corrections within a
In financial markets, the Pullback Indicator is a technical analysis tool that helps traders identify temporary price corrections within a

The best time frame for futures trading is not the same for every trader; it depends on trading style, risk

The Ichimoku indicator is one of the most comprehensive and widely used tools in technical analysis. It is used to

Pivot points are key chart levels where price may reverse, pause, or continue its movement. Traders use them to spot
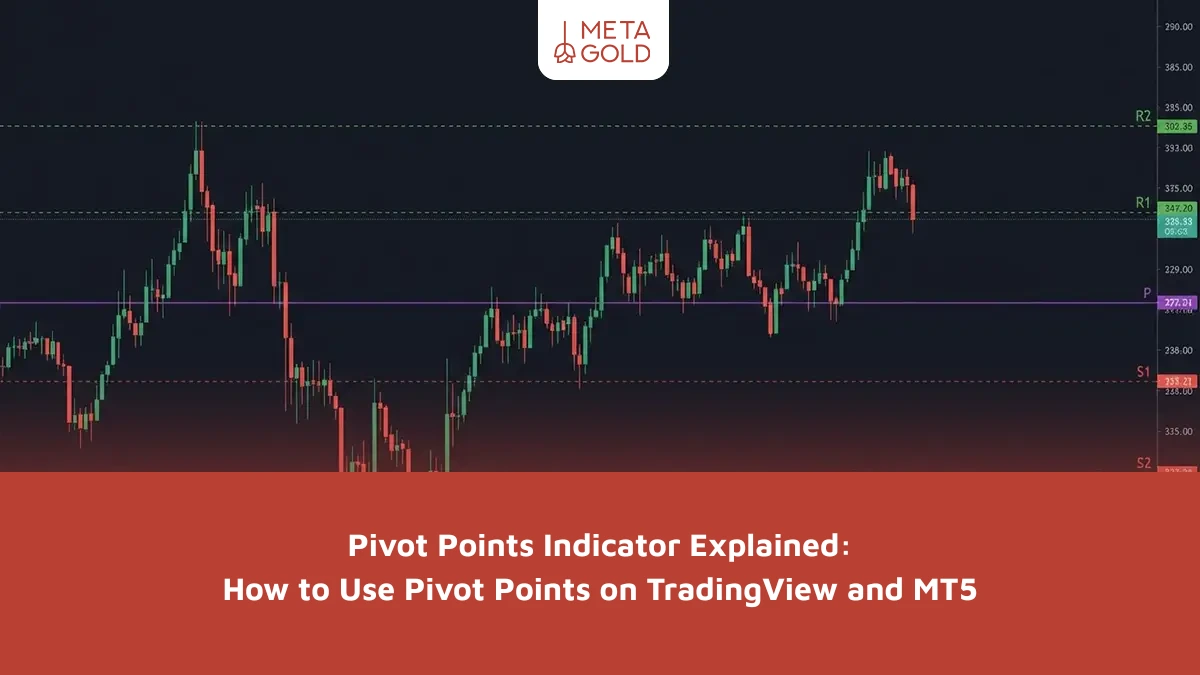
Pivot Points are a technical analysis tool that helps traders identify support and resistance levels using historical price data. They
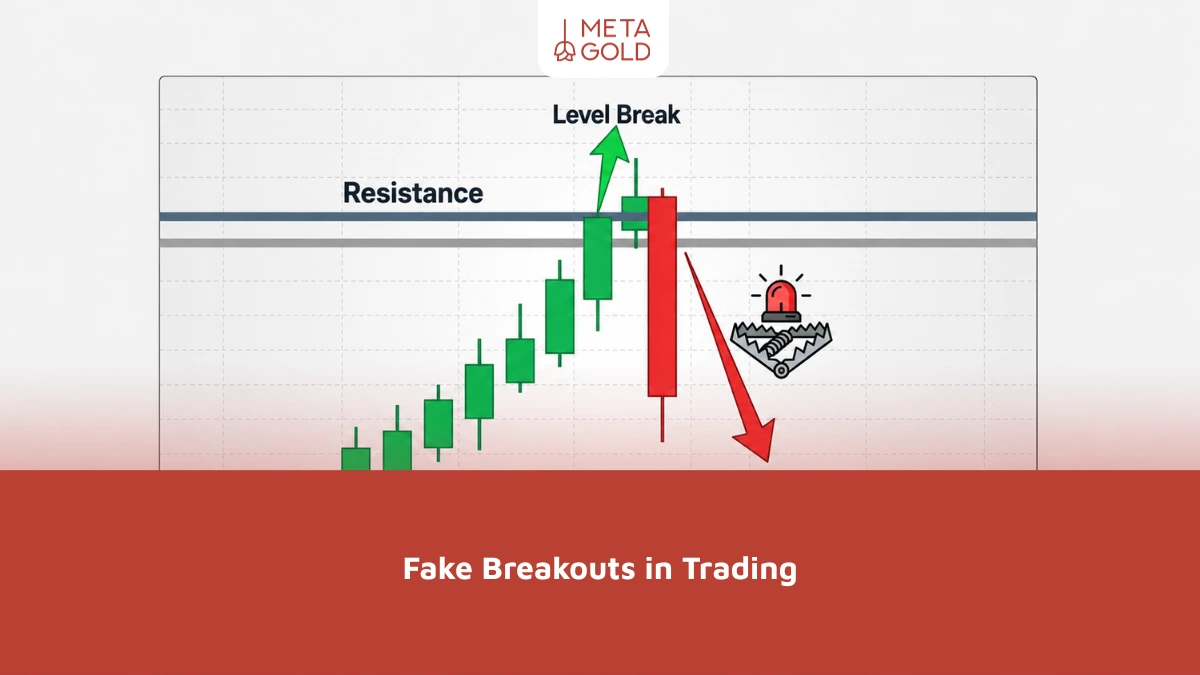
A fake breakout occurs when price briefly moves beyond a key level, support, resistance, or a chart pattern but fails

The Three White Soldiers pattern is a key bullish reversal pattern in technical analysis that appears after a downtrend and
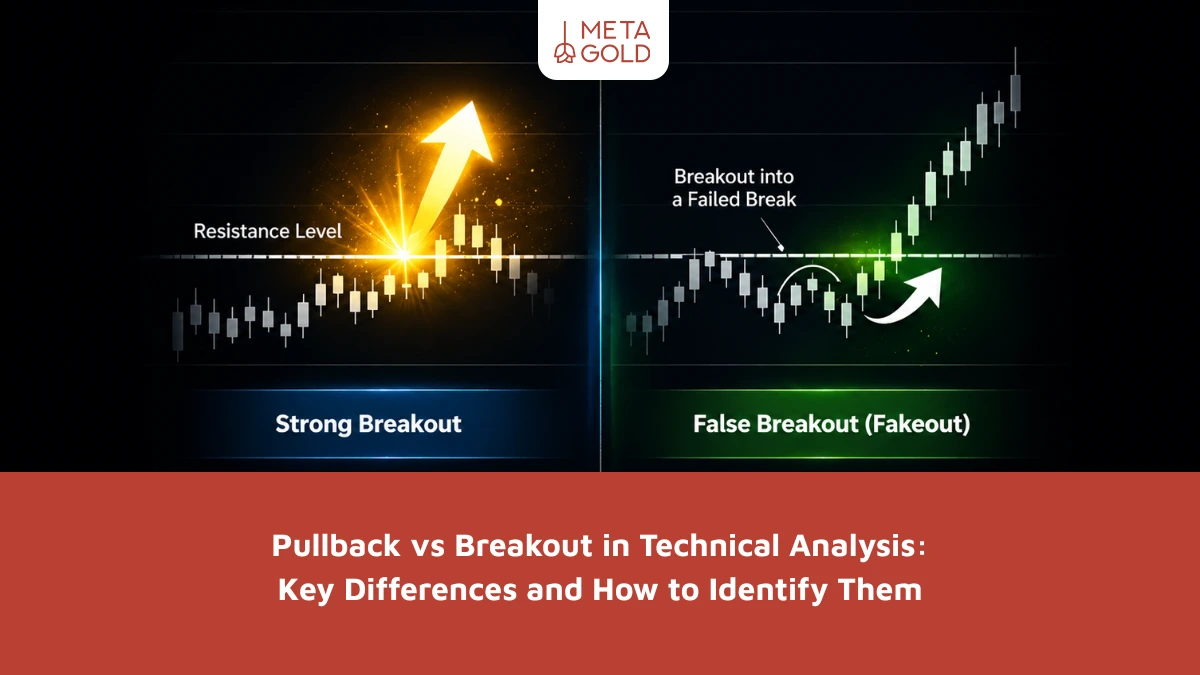
The difference between pullback and breakout in technical analysis relates to two important price behaviors at key levels. A breakout

Trend identification indicators in TradingView such as SuperTrend and ADX help traders identify whether the market is in an uptrend,

The trend-identification indicator on the MetaTrader 5 platform is one of the most important technical analysis tools, as it helps